Top 10 Technical Analysis Chart Patterns Every Trader Should Know
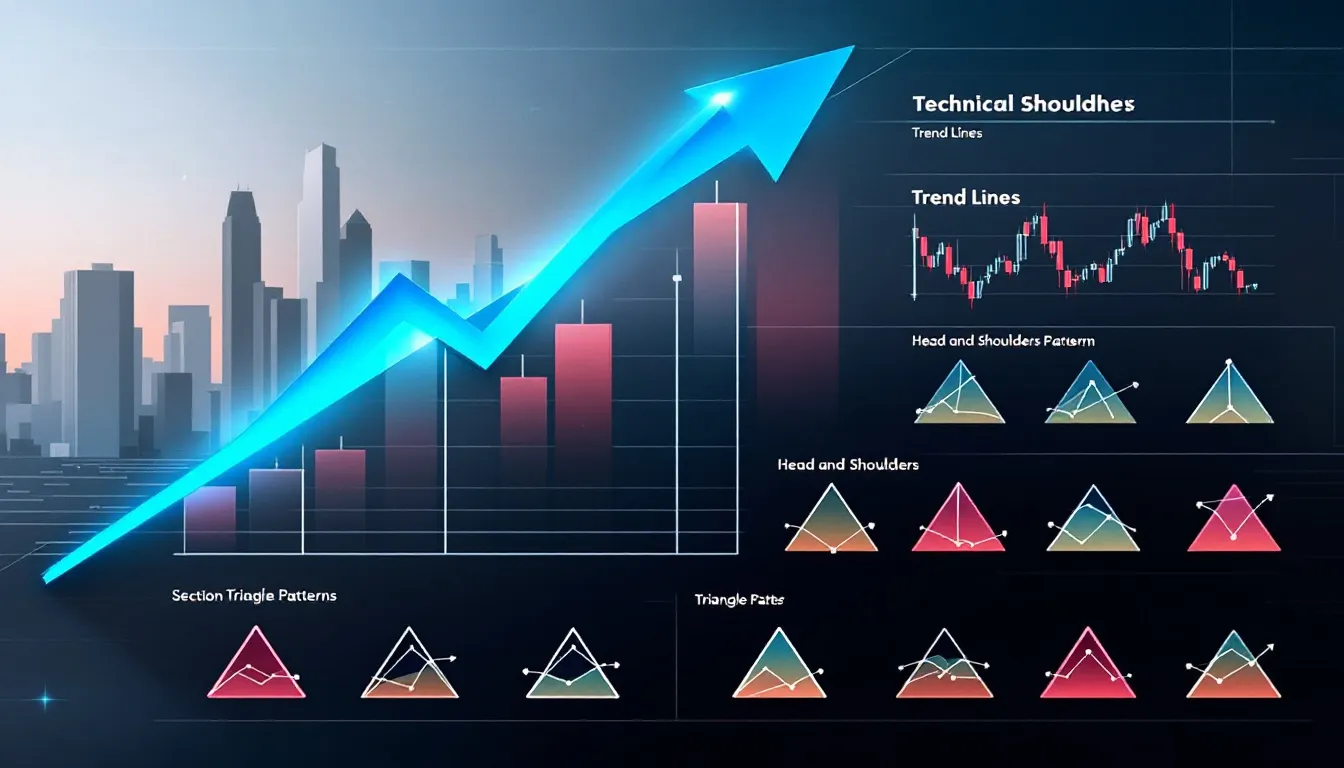
Technical analysis chart patterns are essential for predicting future price movements based on historical data. In this article, we’ll break down the top 10 chart patterns every trader should know and how to use them effectively to enhance your trading strategy.
Table of Contents
Key Takeaways
- Understanding and recognizing chart patterns is essential for traders to anticipate future price movements and make informed trading decisions.
- Chart patterns are classified into three categories: continuation, reversal, and bilateral, each providing insights into market behavior and potential price movements.
- Risk management and confirmation are critical when trading chart patterns to avoid misinterpretation and protect capital from potential losses.
Understanding Technical Analysis Chart Patterns

Chart pattern analysis serves as a critical tool in the arsenal of any trader. The primary purpose of chart patterns is to make educated guesses about future price movements based on historical data. These patterns represent the market’s supply and demand dynamics, which are visually depicted through price charts. Studying these patterns helps traders identify key support and resistance levels, trends, and ranges in the market, offering a roadmap for potential entry and exit points.
One of the key advantages of recognizing chart patterns is the competitive edge they provide. Accurately identifying and interpreting these patterns allows traders to better anticipate market behavior and make informed decisions. This ability to predict future price movements is crucial for both short-term and long-term trading strategies. Chart patterns also offer a visual representation of past price action, helping traders see the bigger picture and understand the underlying market dynamics.
In addition to helping traders enter and exit trades, chart patterns also serve as a valuable tool for improving overall technical analysis. Understanding the interplay of price patterns allows traders to generate short-term trading signals based on price and volume data, enhancing their strategies and increasing their chances of success.
Overall, mastering chart patterns is fundamental for any trader aiming to navigate the complexities of the financial markets effectively.
Key Types of Chart Patterns

Chart patterns can be broadly classified into three primary categories: continuation, reversal, and bilateral patterns. Each category serves a unique purpose in technical analysis and provides insights into different most common chart patterns market behaviors.
Continuation patterns typically emerge during trends, indicating that the trend is likely to resume after a brief pause or consolidation period. These patterns, such as flags and pennants, signal that the current trend will continue once the consolidation phase is over.
On the other hand, reversal patterns suggest a potential shift in price direction, indicating that the current trend may be ending. These patterns, including head and shoulders and double tops, signal that the market is losing momentum in the prevailing trend and is likely to reverse. Recognizing these patterns is crucial for traders looking to capitalize on trend reversals and adjust their trading strategies accordingly.
Bilateral patterns signal uncertainty in price movement and indicate that a breakout could happen in either direction. These patterns, such as symmetrical triangles, reflect periods of indecision or consolidation before the market decides on a direction.
Knowing bilateral patterns helps traders prepare for potential breakouts and manage their positions effectively. Mastering these key types of chart patterns enhances a trader’s ability to identify market trends and make informed trading decisions.
Continuation Patterns
Continuation patterns are essential tools for traders looking to capitalize on the resumption of a trend after a brief pause. These patterns indicate that the trend will continue in its existing direction once the consolidation phase is over. A continuation pattern is identified as a temporary interruption of an existing trend, suggesting that the current trend is likely to persist. Common examples of continuation patterns include flags, pennants, and symmetrical triangles, all of which represent periods of consolidation before the trend resumes.
Knowing how continuation patterns work is crucial for maximizing profits during trending markets. Often emerging during short-term price consolidations, these patterns reflect market behavior before a trend resumption.
For instance, flags and pennants signal that a stock’s move might accelerate once the pause is over, providing traders with opportunities to enter or add to their positions. Recognizing these patterns helps traders anticipate trend continuations and align their strategies accordingly.
Bullish Flag Pattern
The bullish flag pattern is a powerful continuation pattern that signals further upward movement after a strong price increase. This pattern forms when the price consolidates within a downward sloping channel following a rapid upward movement. The consolidation phase resembles a flag on the chart, hence the name. This pattern addresses the psychological need for buyers to pause and regain strength before resuming the upward trend.
Confirmation of a bullish flag pattern comes from observing subsequent bullish candlesticks after a breakout. This confirmation helps ensure that the upward trend is likely to continue, providing traders with a clear signal to enter or add to their long positions.
Recognizing and trading the bullish flag pattern can significantly enhance a trader’s ability to capitalize on strong upward trends in the market.
Bearish Flag Pattern
The bearish flag pattern, in contrast, is characterized by a consolidation phase against the prevailing downward trend. This pattern forms when the price consolidates within an upward sloping channel following a rapid downward movement. The flag represents a period of consolidation before further downside. This pattern is a clear signal that the downtrend is likely to continue after the consolidation phase.
Volume behavior during the consolidation phase of a bearish flag pattern often reflects trader anxiety, as the volume may not decrease significantly. This indicates that traders are uncertain about the next move, leading to a consolidation phase.
Knowing the bearish flag pattern helps traders anticipate further downward movement and position themselves accordingly.
Reversal Patterns

Reversal patterns are vital for traders looking to identify potential changes in the direction of a prevailing trend. These patterns signify that the current trend is losing momentum and is likely to reverse. A reversal pattern indicates a change in the current price trend. It is recognized as a specific price pattern. Common examples of reversal patterns include head and shoulders, double tops, and double bottoms, each indicating a shift in market sentiment.
Recognizing reversal patterns is crucial for capitalizing on trend changes and adjusting trading strategies accordingly. These patterns indicate periods where bullish or bearish momentum is running out, providing traders with opportunities to enter or exit positions before the trend reverses.
Understanding these patterns helps traders navigate volatile markets and make informed decisions based on anticipated trend changes.
Head and Shoulders Pattern
The head and shoulders pattern is one of the most reliable bearish reversal patterns in technical analysis. This pattern consists of three peaks: the middle peak is the highest, known as the head, while the two outside peaks are lower, forming the shoulders. The head and shoulders pattern predicts a bullish to bearish market reversal, indicating that the upward trend is coming to an end.
When the price breaks the neckline of the head and shoulders pattern, buyers lose power, leading to an acceleration in selling positions. This neckline break is a crucial confirmation of the pattern, signaling a significant trend reversal. According to Bulkowski’s study, the head and shoulders pattern has a success rate of 89%, making it a highly reliable bearish reversal pattern.
The head and shoulders pattern is closely related to the double top pattern, as both indicate a failure to move past a resistance level, signaling a bearish reversal. Recognizing and trading the head and shoulders pattern allows traders to anticipate and capitalize on bearish market reversals.
Double Top Pattern
The double top pattern is another powerful bearish reversal pattern characterized by an M-shaped formation created after two consecutive highs with small declines in between. This pattern indicates that the market has failed to break through the resistance level twice, signaling a potential bearish trend reversal.
A crucial confirmation of the double top pattern is the break of the swing low below the neckline, indicating further bearish movement. Traders should avoid basing trades solely on the formation of the two peaks to prevent false readings in double top trading.
Trading the double top pattern helps traders anticipate bearish reversals and adjust their strategies accordingly.
Double Bottom Pattern
The double bottom pattern, in contrast, is a bullish reversal pattern that resembles the letter W. This pattern features two consecutive troughs that sit at the same support level. These troughs are separated by a moderate peak. The double bottom pattern signifies a bullish reversal. It suggests that selling pressure has come to an end and an uptrend is beginning.
When the market price surpasses the resistance level after forming a double bottom pattern, it often indicates a bullish trend. Consequently, the price is likely to keep climbing. Before opening a position after a double bottom formation, traders should confirm the resistance level to ensure a valid breakout.
Trading the double bottom pattern helps traders capitalize on bullish reversals and position themselves for upward trends.
Bilateral Patterns
Bilateral patterns are essential for traders looking to identify potential breakouts in either direction. These patterns often form in ranges or channels and include rectangles and symmetrical triangles, reflecting indecision in the market. Bilateral patterns can suggest either trend continuation or reversal based on the breakout’s direction. Understanding these patterns helps traders prepare for potential breakouts and manage their positions effectively.
A symmetrical triangle pattern, for example, can indicate continuation or reversal depending on market conditions. Recognizing bilateral patterns helps traders anticipate market movements and adjust their strategies to capitalize on potential breakouts. By mastering these patterns, traders can enhance their ability to navigate uncertain market conditions.
Symmetrical Triangle
The symmetrical triangle pattern is a continuation pattern formed between two converging trendlines. This pattern indicates a period of indecision where neither buyers nor sellers are in control, leading to a consolidation phase. As a symmetrical triangle forms, volume typically decreases. This decline suggests a state of indecision in the market.
When the price breaks out of a symmetrical triangle, it can do so either above the upper trendline or below the lower trendline. When there is a breakout in a symmetrical triangle pattern, it indicates a probable continuation of the trend. The breakout’s direction is key in determining the future movement. Traders observe symmetrical triangles as they indicate potential breakouts in either direction, providing opportunities for profitable trades.
Ascending Triangle Pattern
The ascending triangle pattern is typically a bullish continuation pattern, often resulting in upward price movement. This pattern is characterized by a horizontal resistance line and an ascending support line, indicating that buyers are more aggressive than sellers. Traders utilize the ascending triangle pattern to time entries for long trades in the direction of the uptrend, capitalizing on the buying pressure.
Volume indicators are crucial for confirming the presence of the ascending triangle pattern. A breakout above the resistance line indicates a potential new uptrend, providing traders with a strong signal to enter long positions. Recognizing the ascending triangle pattern helps traders anticipate bullish movements and position themselves accordingly.
Descending Triangle Pattern
In contrast, the descending triangle pattern is characterized by lower highs and a horizontal support level, indicating a bearish sentiment in the market. This pattern typically forms during a downtrend and suggests that the price is likely to break lower through the support level. The descending triangle pattern is generally classified as a bearish continuation pattern, signaling further downside.
The formation of the descending triangle pattern includes a descending upper trend line and two trend lines, suggesting that a breakdown is likely to occur. Recognizing this pattern helps traders anticipate bearish movements and position themselves to capitalize on further declines.
Understanding the descending triangle pattern is crucial for traders aiming to navigate bearish market conditions effectively.
Wedge Patterns

Wedge patterns are critical for identifying potential price reversals in the market. These patterns consist of converging trend lines over a specific range of trading periods, indicating a weakening trend and a potential reversal. A key characteristic of a wedge pattern is that its lines tighten toward each other, reflecting diminishing momentum. Unlike triangles and pennants, wedges reflect only upward and downward price movements, making them unique in their formation.
As a wedge pattern progresses, there is typically a decline in volume, indicating weakening momentum. Volume tends to increase significantly upon breakout, signaling potential price movement in the direction of the breakout.
Traders can employ short-term trades within a wedge pattern to capture smaller profits as the price approaches the breakout point. Knowing wedge patterns enables traders to anticipate and capitalize on potential price reversals.
Rising Wedge Pattern
The rising wedge pattern is classified as a bearish pattern, typically indicating a potential downward breakout. This pattern is formed by two converging trend lines that connect higher highs and higher lows, reflecting weakening bullish momentum. As the price moves within the wedge, the narrowing range suggests that the upward trend is losing steam, and a downward breakout is likely.
Traders should look for a downward breakout from the rising wedge pattern to enter new bearish positions or close long positions. Recognizing this pattern helps traders anticipate bearish reversals and adjust their strategies accordingly to capitalize on the downward movement.
Falling Wedge Pattern
Conversely, the falling wedge pattern indicates a bullish reversal in the market. This pattern typically signals that a declining price is losing momentum, suggesting a potential upward reversal. The breakout point for the falling wedge pattern occurs when prices close above the upper descending trendline, confirming the reversal.
Traders should wait for prices to break through a resistance level after a falling wedge breakout. This typically signals the start of an uptrend. This breakout provides a strong signal to enter long positions or close short ones, capitalizing on the upward movement, especially when considering support and resistance lines.
Knowing the falling wedge pattern helps traders anticipate bullish reversals and position themselves for potential gains.
Cup and Handle Pattern
The cup and handle pattern is considered a bullish continuation pattern, indicating that the prior uptrend will resume after a consolidation phase. This pattern is characterized by a ‘U’ shaped cup, followed by a handle that trends downwards slightly, resembling a teacup with a handle. Traders often look for a breakout above the prior peak after a complete cup and handle pattern to enter long positions.
It’s crucial for the volume to decrease during the cup formation and increase when the price breaks out, signaling a strong bullish signal. The cup and handle pattern typically forms over a duration ranging from seven weeks to over a year, providing traders with ample time to recognize and act on the pattern.
Recognizing this pattern helps traders capitalize on bullish continuations in the market.
How to Identify Chart Patterns

Identifying chart patterns requires a keen understanding of trendlines, which connect common price points to form patterns. A valid trendline typically requires at least three price points for accuracy, providing a clear visual of the pattern. Chart patterns should also be validated with volume trends to confirm breakout signals, ensuring the reliability of the pattern.
Volume trends often decline during the formation of chart patterns, then increase upon breakout, signaling potential price movement. Traders can enhance their strategies by combining chart patterns with other technical indicators, providing a more comprehensive analysis of market conditions.
Knowing how to identify patterns in chart patterns is crucial for making informed trading decisions.
Using Chart Patterns in Trading Strategies
Chart patterns play a significant role in trading strategies as they help identify potential market reversals or continuations. Recognizing chart patterns enables traders to assess trade setups and anticipate future price behavior, enhancing their ability to make informed decisions. Utilizing multiple time frames can further enhance the reliability of chart patterns, providing a more comprehensive market analysis.
Entering a position based on a chart pattern requires setting a stop loss to manage risk effectively. Setting a stop loss helps close positions automatically if the market moves against the trader, protecting capital and minimizing losses. Risk management is critical because chart patterns can fail, leading to potential losses. Traders should confirm the move, place a stop loss, and set profit targets to manage risk effectively.
Profit targets help determine where to place take profit orders, helping traders calculate their risk-reward ratio. For specific patterns like the cup and handle, the target can be calculated by adding the height of the cup to the breakout point of the handle. Incorporating chart patterns into trading strategies enhances traders’ ability to navigate the markets and achieve their goals.
Common Mistakes to Avoid with Chart Patterns
One common mistake traders make is misinterpreting chart patterns due to a lack of experience, leading to poor decision-making. Chart patterns are subject to subjective interpretation and may provide false signals, so it is crucial to establish a clear entry and exit strategy. Waiting for confirmation before entering a trade helps avoid false breakouts and reduces the risk of losses.
Risk management techniques are essential when trading chart patterns to protect capital. Overtrading on minor patterns can lead to excessive losses, so disciplined trading is crucial.
Traders should also avoid ignoring the context of the overall market trend, as this can lead to significant errors in trading decisions based on chart patterns. Knowing these common mistakes helps traders improve their strategies and avoid potential pitfalls.
Summary
In summary, understanding and utilizing technical analysis chart patterns is essential for any trader looking to succeed in the financial markets. From continuation patterns that signal trend resumption to reversal patterns that indicate potential changes, each pattern provides valuable insights into market behavior. By recognizing and interpreting these patterns, traders can enhance their ability to make informed decisions and capitalize on market opportunities.
By avoiding common mistakes and incorporating risk management techniques, traders can improve their strategies and protect their capital. Mastering chart patterns is a continuous learning process, but with dedication and practice, traders can gain a competitive edge and achieve their trading goals. Embrace the power of chart patterns, and let them guide you toward success in your trading journey.
Frequently Asked Questions
What are the three primary categories of chart patterns?
The three primary categories of chart patterns are continuation, reversal, and bilateral patterns. Each category serves to indicate market behavior, with continuation patterns signaling trend resumption, reversal patterns suggesting potential direction changes, and bilateral patterns indicating possible breakouts in either direction.
How can traders confirm a chart pattern breakout?
To confirm a chart pattern breakout, traders should look for an increase in volume at the time of the breakout, as this indicates strong market interest. Additionally, using other technical indicators alongside chart patterns can further enhance the reliability of the breakout signal.
What is the significance of the head and shoulders pattern in trading?
The head and shoulders pattern is significant as it signals a reliable bearish reversal, indicating a transition from bullish to bearish market conditions. A break of the neckline confirms this trend reversal, prompting traders to consider entering bearish positions.
How do traders use the cup and handle pattern in their strategies?
Traders utilize the cup and handle pattern as a bullish continuation signal, entering long positions upon a breakout above the prior peak, especially when accompanied by increased volume, which strengthens the validity of the signal. This strategic approach enhances the potential for successful trades.
What are common mistakes to avoid when trading chart patterns?
To avoid common mistakes when trading chart patterns, ensure you do not misinterpret patterns and remain mindful of overall market trends. Additionally, implement risk management techniques and wait for confirmation before entering trades.


Comments: 0