

Top Trading Pattern Cheat Sheet
If you are navigating the financial markets, you’ll want to recognize trading chart patterns. Chart patterns are visual representations of market behavior and they help you predict future price movements based on past market data. This guide provides a trading patterns cheat sheet to help you quickly identify opportunities, understand trend direction, and avoid common pitfalls.
Table of Contents
Trading Patterns Cheat Sheet
What Are Chart Patterns?
Chart patterns are graphical representations of price movements plotted on a price chart. They reflect the interplay between supply and demand in the market and reveal patterns that traders can use to predict potential trend reversals or trend continuations.
Types of Chart Patterns
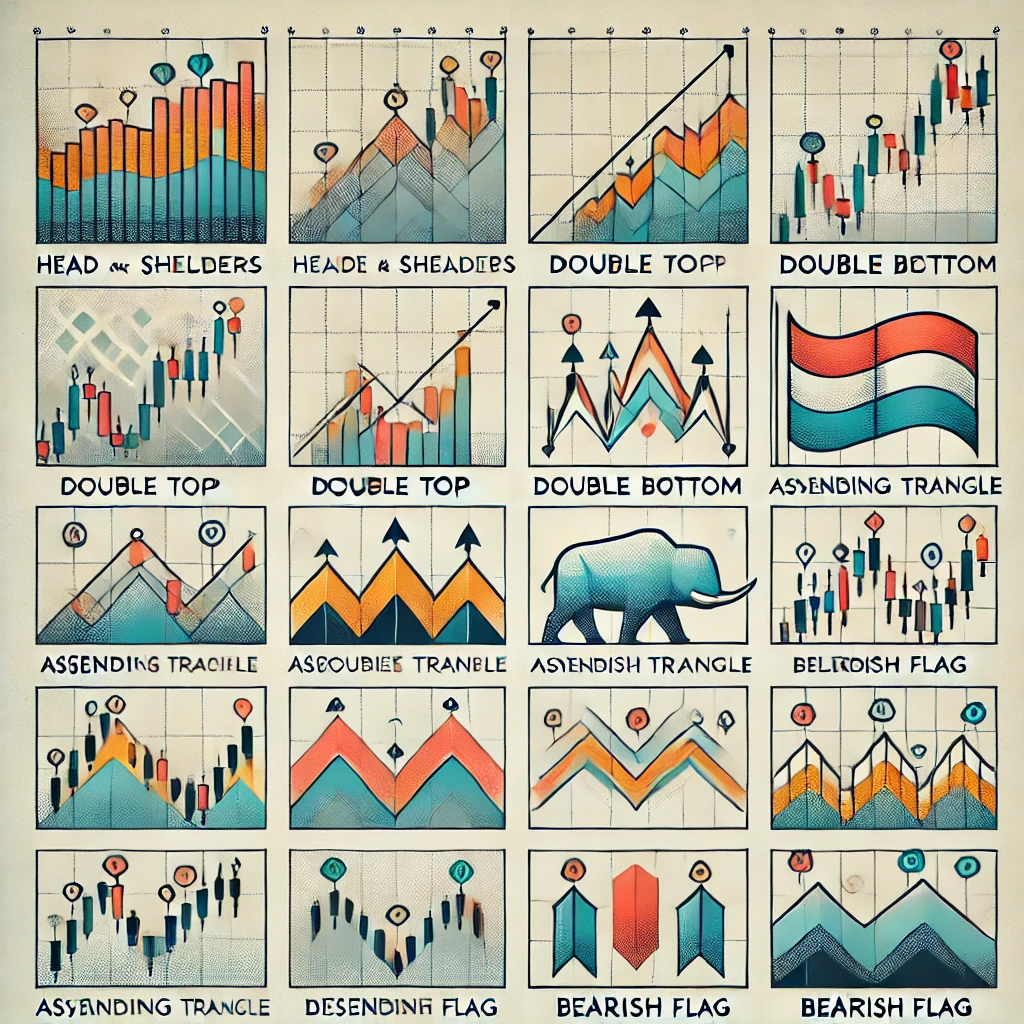
Chart patterns cheat sheet are broadly classified into three categories:
- Reversal Patterns
Indicate a change in the prevailing trend.- Examples: Head and Shoulders Pattern, Double Top, Double Bottom.
- Continuation Chart Patterns
Suggest that the current trend will likely continue.- Examples: Bullish Flag, Bearish Flag, Triangle Chart Patterns.
- Bilateral Patterns
Indicate the price could move in either direction, providing potential trading opportunities for bullish and bearish scenarios.- Examples: Symmetrical Triangle, Ascending Triangle, Descending Triangle, Symmetrical Triangle, Rectangle Chart Patterns.
Using Chart Patterns Cheat Sheet for Trading
Chart patterns play a crucial role in technical analysis. With them, you can:
- Identify entry and exit points based on breakout or reversal signals.
- Predict price movements using patterns like ascending triangles or bearish reversal patterns.
- Combine patterns with technical indicators – such as Relative Strength Index (RSI) or moving averages – for greater accuracy.
How to Use Chart Patterns Effectively
- Analyze the Preceding Trend
Always assess the preceding trend before interpreting a pattern. For instance, a bullish reversal pattern like the Double Bottom is valid only after a downtrend. - Confirm with Other Technical Analysis Tools
Pair chart patterns with technical indicators and fundamental analysis to strengthen predictions. - Define Support and Resistance Levels
Use support lines and resistance lines to identify critical price points where breakouts or reversals may occur.
Key Chart Patterns Explained
1. Head and Shoulders Pattern
- Type: Reversal Pattern
- Features: A peak (head) flanked by two lower peaks (shoulders).
- Trend: Signals a bearish reversal after an uptrend.
- Usage: Look for a breakout below the neckline to confirm the reversal.
2. Double Top and Double Bottom
- Type: Reversal Patterns
- Features:
- Double Top: Two consecutive peaks at similar levels, indicating a bearish reversal. This bearish reversal pattern signals a potential shift from an uptrend (bullish) to a downtrend (bearish).
- Double Bottom: Two consecutive troughs at similar levels, indicating a bullish reversal. This bullish reversal pattern indicates a potential shift from a downtrend (bearish) to an uptrend (bullish).
- Usage: Monitor for a breakout above resistance or below support to confirm the trend.
3. Triangle Chart Patterns
- Types:
- Ascending Triangle: Bullish continuation pattern with a rising support line.
- Descending Triangle: Bearish continuation pattern with a declining resistance line.
- Symmetrical Triangle: Bilateral pattern formed by converging trendlines with similar slopes. It signals a potential breakout in either direction.
- Usage: Pay attention to breakout direction to make trading decisions.
4. Flags and Pennants
- Types: Bullish Flag, Bearish Flag
- Features: Short-term consolidation after a strong price movement, followed by a continuation of the trend.
- Usage: Enter trades after a breakout in the direction of the preceding trend.
5. Rectangle Chart Patterns
- Type: Continuation or Bilateral Pattern
- Features: Price consolidates within parallel support and resistance lines.
- Usage: Trade based on the breakout direction, either above resistance or below support.
6. Rising and Falling Wedges
- Type: Reversal or Continuation Pattern
- Features:
- Rising Wedge: Bearish pattern signaling a reversal or continuation of a downtrend.
- Falling Wedge: Bullish pattern signaling a reversal or continuation of an uptrend.
- Usage: Watch for a breakout to confirm the trend.
Common Mistakes in Trading Patterns
1. Ignoring the Broader Market Context
You should interpret chart patterns within the context of overall market trends. If you rely on patterns without considering market conditions, you may end up making poor decisions.
2. Misidentifying Patterns
Confusing similar patterns, such as a Double Top with a Rectangle Chart Pattern, can lead to inaccurate predictions.
3. Overlooking False Breakouts
False breakouts are common in technical patterns. You should always confirm breakouts with other technical analysis tools or indicators like RSI.
4. Failing to Set Stop-Loss Orders
If you don’t set stop-loss orders, especially in highly volatile markets, you’ll be exposed to substantial risk.
Example of a Trading Pattern: Head and Shoulders
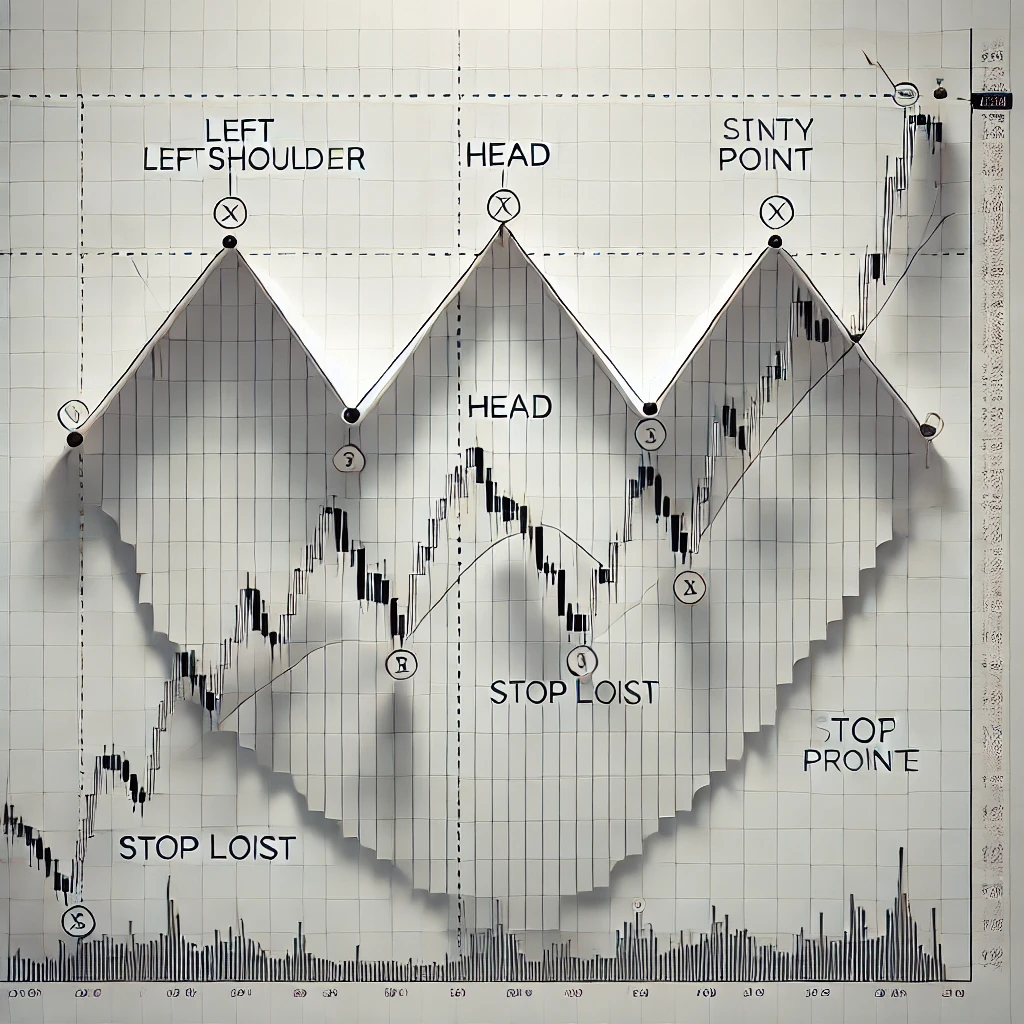
The Head and Shoulders Pattern is one of the most popular and reliable reversal patterns in technical analysis. Here’s how it works and how to use it effectively:
Understanding the Pattern
- Formation:
- The pattern forms during an uptrend. It has three peaks:
- Left Shoulder: A moderate peak followed by a pullback.
- Head: A higher peak that surpasses the left shoulder, followed by another pullback.
- Right Shoulder: A peak similar in height to the left shoulder. It indicates weakening momentum.
- The pattern forms during an uptrend. It has three peaks:
- Neckline:
- A support line drawn beneath the lows of the two pullbacks. This is the breakout level.
How It Signals a Reversal
When the stock price drops below the neckline after forming the right shoulder, it signals a potential bearish reversal. This means that sellers are in control, and the uptrend will reverse into a downtrend.
Step-by-Step Trading Example
- Identify the Pattern:
- Spot the left shoulder, head, and right shoulder in an uptrend. Make sure the neckline is horizontal or slightly downward sloping.
- Confirm the Breakout:
- Wait for the stock price to close below the neckline. A strong breakout with higher-than-average volume is even better.
- Entry Point:
- Enter a short position just below the neckline.
- Stop-Loss Placement:
- Place a stop-loss order above the high of the right shoulder to limit potential losses if the pattern fails.
- Profit Target:
- Measure the vertical distance from the head to the neckline. Subtract this distance from the breakout point to determine the target price.
Practical Example
- Imagine a stock, it is trending upward and forms a left shoulder at £50, a head at £55, and a right shoulder at £52. The neckline is at £48.
- When the stock breaks below the neckline at £48, enter a short trade.
- Set a stop-loss at £52 and aim for a profit target of £41 (calculated as £55 – £48 = £7; £48 – £7 = £41).
FAQs
What Is a Trading Patterns Cheat Sheet?
A trading patterns cheat sheet is a quick reference guide summarizing common chart patterns, their types, and usage in trading. It can help you in your trading journey to generate profits.
Are Chart Patterns Reliable?
Chart patterns are generally reliable but should be used alongside technical analysis tools and fundamental analysis to account for market variations.
How Do Triangle Chart Patterns Work?
Triangle chart patterns like ascending triangles and descending triangles signal potential breakouts. You should monitor the breakout direction to predict future price movements.
What Are Continuation Patterns?
Continuation patterns, such as Flags and Pennants, indicate that the current trend is likely to continue after a brief consolidation phase.
Why Are Chart Patterns Important for Trading Decisions?
Chart patterns provide insights into market trends. Traders can thus anticipate price movements, identify entry and exit points, and improve their trading strategies.
What Is the Most Successful Trading Pattern?
The success of a trading pattern depends on your strategy, market conditions, and how well the pattern is identified and used. However, some patterns, like Head and Shoulders, Double Top and Double Bottom, Bullish and Bearish Flags and Ascending and Descending Triangles, stand out for their reliability and frequent application in various markets.


Comments: 0