


W Pattern Trading: The Ultimate Guide to Double Bottoms
W pattern trading, also called double bottom trading, helps you spot potential bullish reversals. This guide will show you how to identify the W pattern, why it’s important, and how to trade it successfully.
Table of Contents
Key Takeaways
- The W pattern, or double bottom, indicates a bullish reversal after a downtrend, marked by two lows and an intermediate high, with a breakout above the neckline signaling increased buyer activity.
- Traders should confirm the W pattern through volume analysis and additional indicators like RSI and MACD, avoiding premature entries and ensuring the breakout is timely and validated.
- Effective risk management strategies, including precise stop-loss placement and well-defined profit targets based on pattern height, are crucial for successful trading using W patterns.
Understanding the W Pattern
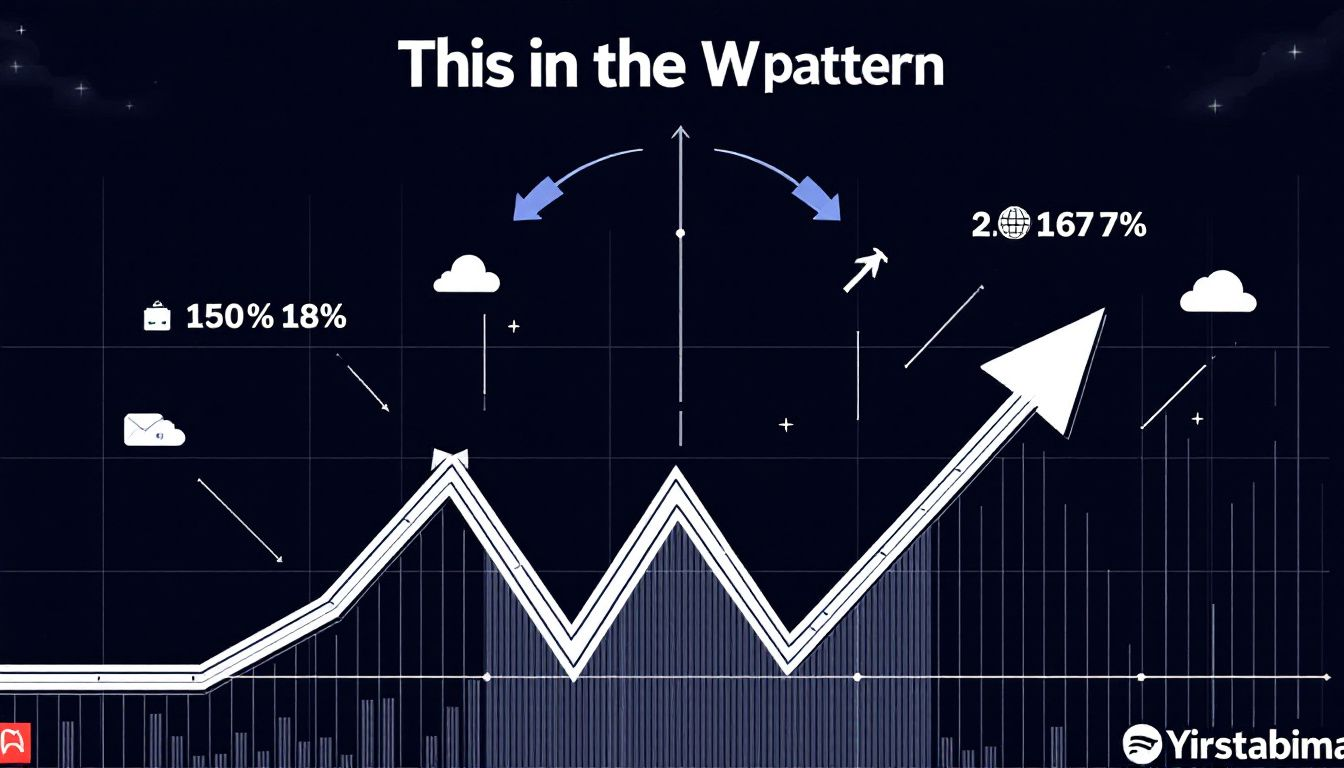
The W pattern, also known as a double bottom pattern, is a powerful bullish reversal chart pattern that resembles the letter ‘W’ on a price chart. This pattern typically appears after a downtrend, indicating a potential shift from bearish to bullish market conditions. The pattern forms when the price drops to a support level, rebounds, drops again to roughly the same level, and then rises once more, creating two distinct lows and an intermediate high. Double bottom patterns can signify a strong reversal in market sentiment.
The significance of the W pattern lies in its ability to signal a reduction in downward momentum, which can lead to increased buyer activity. The central high represents a temporary rebound in price, suggesting potential bullish activity but not a complete trend reversal. When the price breaks above the neckline, formed by connecting the intermediate high, it often indicates a successful breakout and the beginning of an upward trend and a bullish trend.
Traders must understand the W pattern to identify potential bullish reversals in a downtrend. This pattern indicates a shift in market sentiment from seller dominance to buyer control, marking a crucial turning point. Effectively recognizing and trading this pattern can lead to more successful trades and improved outcomes.
Identifying the W Pattern on Price Charts
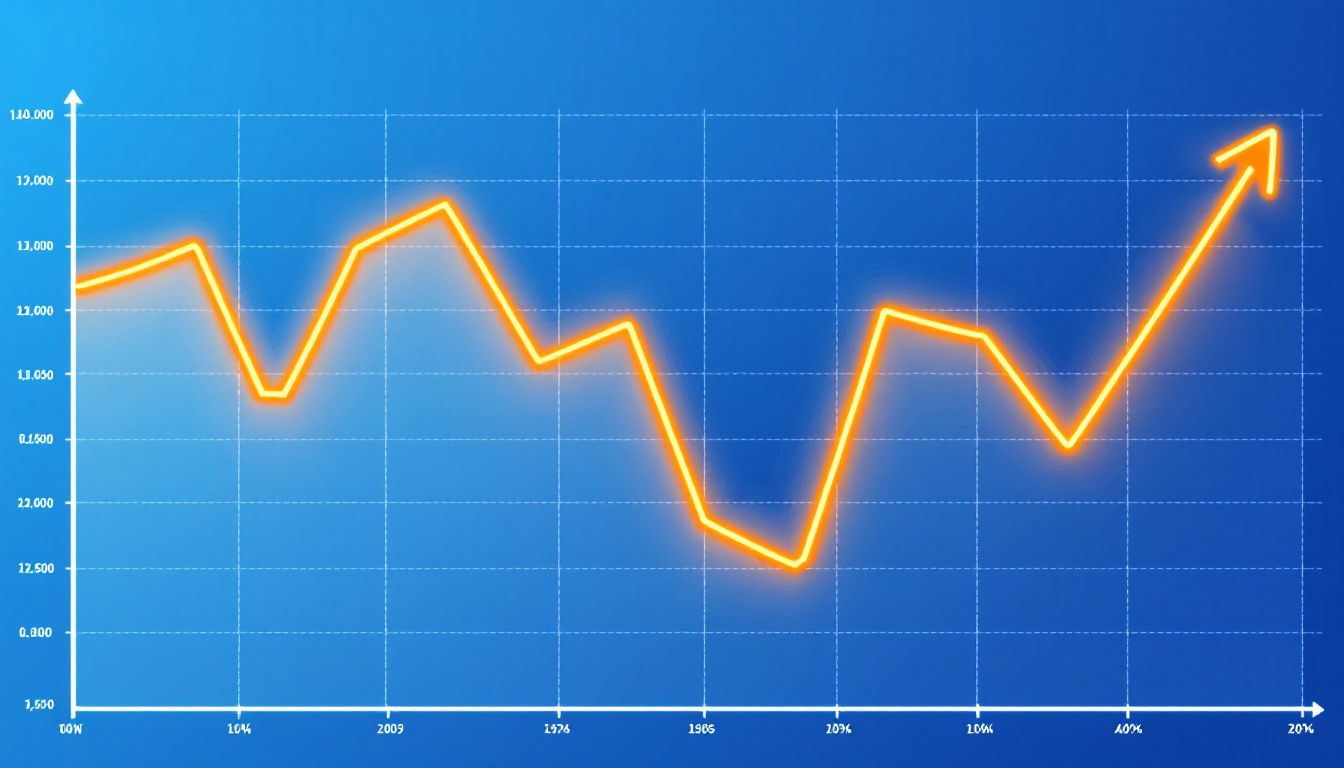
Spotting the W pattern on price charts involves recognizing specific price movements and key elements. First, identify a downward trend in price movement. The W pattern forms when the price drops to a support level, rebounds, drops again to the same support level, and then rises.
This pattern is versatile and can be applied across various markets and timeframes, making it a valuable tool for traders. However, subjective interpretations can sometimes lead to misidentification, so precision in chart patterns is key.
Recognizing Key Elements
The key elements of a W pattern include two distinct lows and an intermediate high. These components are crucial in identifying the pattern and understanding its implications for potential market reversals. The two lows should be at roughly the same level, indicating strong support, and the peak between them creates a resistance level.
Heikin-Ashi candles can be particularly useful in identifying W patterns as they smooth out price action and highlight trends. The first low represents the initial selling pressure, followed by a rebound creating the intermediate high. The second low is crucial as it shows the inability of sellers to push the price lower, indicating weakening bearish momentum and increasing buying interest.
These key elements provide traders with valuable insights into potential market shifts and upward trends. Accurate identification of the W pattern can significantly enhance trading strategies and outcomes.
Drawing the Neckline
Drawing the neckline is a crucial step in confirming the W pattern setup. The neckline is drawn through the peak formed between the two bottoms in a W pattern. This line acts as a resistance level, and a breakout above this line confirms the pattern and signals a potential bullish reversal.
Drawing the neckline correctly ensures that traders can identify and confirm the W pattern before making trading decisions.
Confirming the Breakout
A confirmed breakout occurs when the price closes above the trendline connecting the two lows. This breakout above the intermediate high signals a potential bullish reversal, indicating that buyers are gaining control. Volume analysis plays a critical role in confirming the breakout, as growing volumes during the price rise indicate bullish strength and buyer conviction.
Increasing on-balance volume (OBV) during price consolidation may also signal that the price is set to break above the neckline. When spotting the W pattern, confirming it with other indicators, such as volume and OBV, is a recommended trading approach to ensure the validity of the breakout and reduce the risk of false signals.
Analyzing Market Sentiment with W Patterns

The W pattern is a useful tool for analyzing market sentiment. It signals a shift from seller dominance to buyer control. Following the first trough, buyers entering the market signal a shift in sentiment despite the temporary resistance. This pattern trading serves as an indicator for potential bullish market reversals, reflecting changing market sentiment.
A rising Relative Strength Index (RSI) during the formation of the second low can reinforce the potential for a bullish reversal. RSI readings above 30 during the second low formation suggest increasing buying pressure. The inability of sellers to push the price below the first trough characterizes a key moment of weakening bearish momentum, further indicating a shift toward buyer dominance and potential upward momentum.
Trading Strategies for W Patterns

Effective trading strategies for W patterns involve identifying entry points, setting stop-loss orders, and determining profit targets. Once the price breaks the resistance level formed between the troughs, it confirms a bullish takeover by buyers.
Using additional indicators like RSI, volume, or MACD confirms the patterns and enhances the success of W pattern trades.
Entry Points
Traders should enter a long position when the price surpasses the intermediate high of the W pattern. Using Fibonacci retracement levels helps identify potential entry points and manage risk effectively. This approach allows traders to capitalize on the upward momentum while having a clear strategy for managing their trades.
Gradually scaling into positions, or partial position entries, allows traders to manage risk better as market conditions change. Starting with smaller positions and increasing their stake as market confirmation strengthens can improve overall trading outcomes.
Stop-Loss Placement
The stop-loss should be positioned just below the second low of the W pattern to effectively manage risk. Setting effective stop-loss orders is vital for managing trading risks and ensuring better outcomes.
Failing to implement these risk management strategies can lead to significant losses.
Profit Targets
Profit targets for W pattern trades can be determined by measuring the height of the pattern and projecting it upward from the breakout point. This method provides a clear take-profit level based on the pattern’s structure, helping traders maximize their gains.
Alternatively, measure the distance between the bottoms of the W pattern and the neckline, then project that distance upward for the take-profit level. Setting profit targets is vital for maximizing gains and ensuring successful trades.
Enhancing Accuracy with Technical Indicators
Incorporating multiple technical indicators can significantly improve trading outcomes when utilizing W patterns. Advanced strategies in W pattern trading involve integrating Fibonacci retracement levels and using additional technical indicators for informed trading decisions.
Volume Confirmation
Volume analysis validates W pattern formations by indicating buyer pressure and selling interest. Higher trading volumes at the lows of a W pattern often signal strong buying interest, confirming the pattern’s integrity.
Volume spikes during a breakout indicate the strength of the price movement and buyer conviction. Traders should seek large trading volumes at breakouts to increase the probability of successful trades based on W patterns.
In summary, volume plays a crucial role in validating W pattern formations and guiding trading strategies.
RSI Analysis
Bullish divergence occurs when the price forms a higher second low while the RSI indicates a lower low. During the formation of the second low of the W pattern, the RSI can indicate bullish divergence, suggesting a potential price reversal. This signal helps traders strategically time their entries based on early momentum shifts.
If the price is making a lower low while the RSI is making a higher low, it signals that selling pressure is weakening. Confirming bullish divergence with the RSI can enhance trading strategies and improve outcomes.
MACD Signals
A decline in the MACD during the W pattern formation can indicate weakening bearish momentum. MACD histogram increases after a breakout validate the bullish trend indicated by the W pattern, providing additional confirmation for traders.
Incorporating MACD signals into trading strategies can enhance the accuracy of trading decisions and improve the likelihood of successful trades.
Common Mistakes in W Pattern Trading
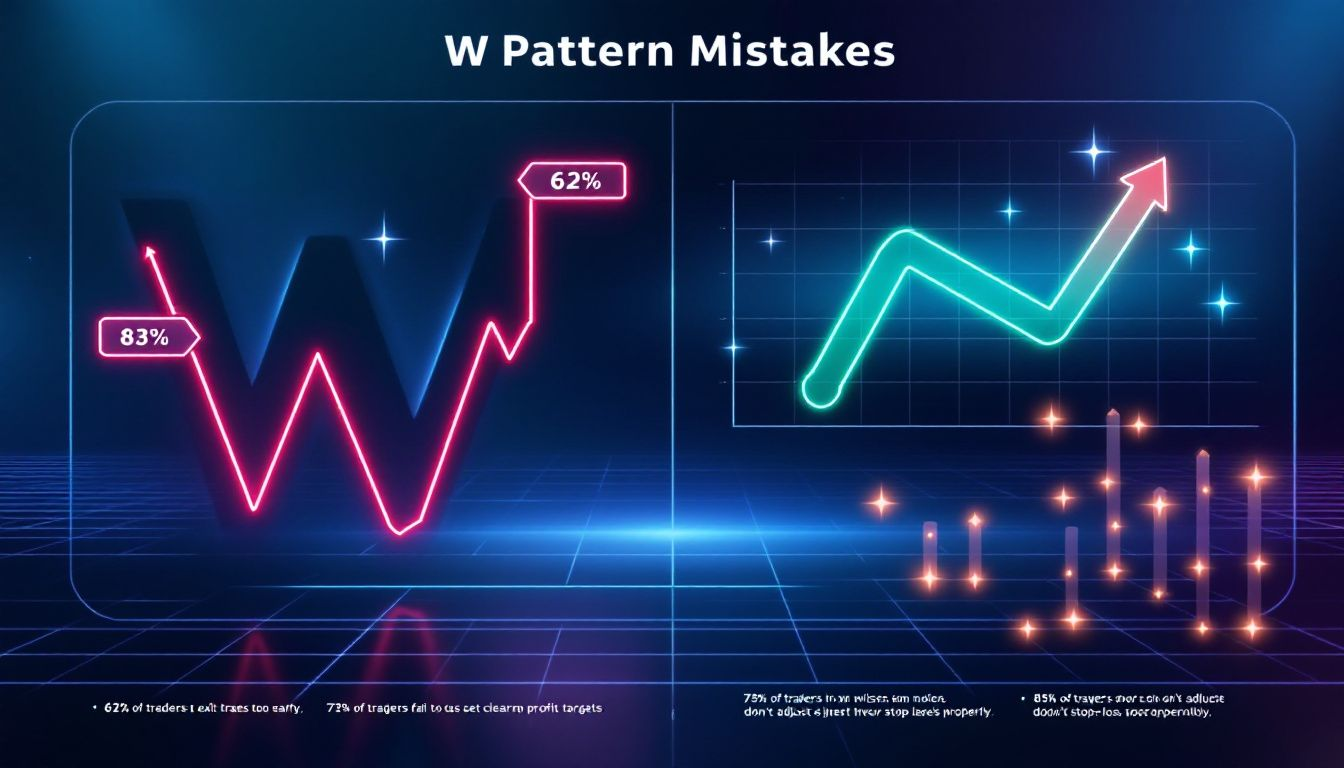
Common mistakes in W pattern trading include entering trades before the price breaks above the intermediate high of the W pattern. This premature entry can lead to significant losses if the breakout does not occur. Ignoring volume during a breakout can lead to missed confirmations and increased risk.
Confusing the W pattern with other patterns, like the double top pattern and the m pattern, can result in poor trading decisions. Traders need to be cautious about pattern failures that can result in financial losses.
Education and practice can help traders avoid these common mistakes and improve their trading outcomes.
Advanced Techniques for W Pattern Trading
Advanced techniques in W pattern trading include combining Fibonacci retracement, partial position entries, and pullback trading. These strategies can enhance entry and exit points, manage risk better, and provide additional confirmation for trend continuation.
Combining with Fibonacci Retracement
The integration of Fibonacci retracement levels aids in pinpointing key entry and exit points during W pattern trades. Integrating Fibonacci levels with W pattern trading can pinpoint critical support and resistance zones, enhancing the effectiveness of trading strategies.
Partial Position Entries
The partial position entry strategy involves scaling into trades with smaller initial positions. This approach allows traders to manage risk while waiting for stronger confirmation signals before increasing position size. By starting with a smaller position, traders can reduce their exposure to potential losses if the market moves against them.
As confirmation signals strengthen, traders can add to their positions, potentially leading to better overall results. This method also provides flexibility, enabling traders to react more effectively to market movements and adapt their strategies based on evolving market conditions.
Pullback Trading
Pullback trading involves waiting for a slight retracement after a W pattern breakout before entering the trade. This strategy provides additional confirmation of trend continuation, reducing the risk of entering a false breakout. Traders should look for confirmation signals, such as a moving average crossover or bullish candlestick patterns, to increase the likelihood of successful trades.
By waiting for a retracement, traders can enter at a more favorable price, potentially increasing their profit margins. This method also allows traders to confirm the breakout’s strength and the trend’s continuation, making it a valuable addition to their trading strategies.
Pros and Cons of W Pattern Trading
W pattern trading has several advantages and drawbacks that traders should consider. Knowing both sides enables traders to make more informed decisions and manage their trades better.
This section explores the key benefits and potential challenges associated with trading W patterns.
Advantages
W pattern trading offers identifiable entry and exit points, making it easier for traders to execute their strategies effectively. This strategy also offers a good risk-reward ratio due to clearly defined stop-loss and profit targets.
Overall, a trading strategy involving W patterns enhances effectiveness by offering clear guidelines and favorable conditions.
Drawbacks
Despite its advantages, W pattern trading can involve drawbacks such as false signals and the need for thorough technical analysis. False signals may occur, leading traders to make incorrect decisions based on a potentially failed pattern. Successful W pattern trading requires proficient knowledge of technical analysis, which can be challenging for novice traders.
External factors like sudden market news and volatility can influence the effectiveness of W patterns. Subjective interpretation can lead to misidentification of W patterns. This may result in poor trading decisions. Traders need to be aware of these challenges and continuously improve their skills to minimize risks.
Summary
In summary, W pattern trading is a valuable tool for identifying potential bullish reversals in financial markets. By understanding the key elements of the W pattern, drawing the neckline, and confirming breakouts with volume and other technical indicators, traders can enhance their trading strategies and improve their outcomes.
Trading W patterns offers clear entry and exit points, favorable risk-reward ratios, and the potential for successful trades. However, traders must be aware of common mistakes, false signals, and the need for thorough technical analysis. By incorporating advanced techniques and continuously refining their strategies, traders can maximize the benefits of W pattern trading and achieve better trading results.
Frequently Asked Questions
What is a W pattern in trading?
A W pattern, or double bottom pattern, is a bullish reversal formation resembling the letter ‘W’ on a price chart, signaling a possible transition from a downtrend to an uptrend. Recognizing this pattern can help you identify potential buying opportunities.
How can I identify a W pattern on a price chart?
To identify a W pattern on a price chart, observe two lows at similar levels separated by a peak. This pattern indicates a price drop to a support level, followed by a rebound, another drop to the same support, and a subsequent rise.
What are the key elements of a W pattern?
A W pattern consists of two distinct lows, an intermediate high, and a neckline that connects the peak between the lows, indicating a potential bullish reversal. Recognizing these components can enhance your trading strategy.
How can I confirm a breakout in a W pattern?
To confirm a breakout in a W pattern, ensure the price closes above the neckline formed by the intermediate high, supported by increased volume and technical indicators like RSI and MACD. This validation will strengthen the breakout’s reliability.
What are the common mistakes in W pattern trading?
Common mistakes in W pattern trading involve entering trades before the price breaks above the intermediate high, neglecting volume during breakouts, and misidentifying the W pattern as other formations like the double top. Being well-educated and gaining practice can effectively mitigate these errors.


Comments: 0