


What is RSI Divergence? A Guide to Understanding Its Trading Signals
RSI (Relative Strength Index) divergence is a powerful tool used in technical analysis to detect potential market reversals. By understanding RSI divergence, traders can identify buy and sell signals with greater accuracy.
Table of Contents
In this guide, you’ll learn: ✔ What RSI divergence is and how it works
✔ How to identify bullish and bearish divergence
✔ How to use the RSI divergence indicator
✔ Common trading strategies based on RSI divergence
Let’s dive into the world of RSI and uncover its potential to improve trading decisions.
What is RSI Divergence?
RSI Divergence occurs when the price of an asset moves in the opposite direction of the RSI indicator. This signals a potential trend reversal or a shift in market momentum.
RSI divergence occurs when the price of an asset and the Relative Strength Index (RSI) move in opposite directions, indicating potential trend reversals.
The RSI indicator (Relative Strength Index) is a momentum oscillator that measures the speed and change of price movements on a scale from 0 to 100. Typically:
- Above 70 – Overbought (potential for a price decline)
- Below 30 – Oversold (potential for a price increase)
When price and RSI move in different directions, it creates a divergence, signaling a possible trend change.
Definition of RSI Divergence
RSI divergence is a key concept in technical analysis that occurs when the Relative Strength Index (RSI) indicator and the price of a security move in opposite directions. This divergence can manifest as either bullish or bearish, each signaling a potential trend reversal. When the price of an asset is making new highs but the RSI fails to reach new highs, it indicates a bearish divergence. Conversely, when the price is making new lows but the RSI fails to reach new lows, it signals a bullish divergence. These divergences are crucial for traders as they highlight changes in market momentum, allowing for more informed trading decisions. Understanding RSI divergence can significantly enhance a trader’s ability to predict and capitalize on market movements.
How RSI Divergence Works
RSI divergence works by comparing the price movement of a security with the movement of the RSI indicator. When the price of a security is making new highs, but the RSI is failing to reach new highs, it indicates a bearish divergence. This suggests that the uptrend is losing strength and a potential downward reversal may be on the horizon. Conversely, when the price is making new lows, but the RSI is failing to reach new lows, it indicates a bullish divergence. This signals that the downtrend is losing momentum and an upward reversal could be imminent. By identifying these divergences, traders can anticipate trend reversals and adjust their trading strategies accordingly, making RSI divergence a powerful tool in technical analysis.
Calculating RSI
The RSI is calculated using the following formula:
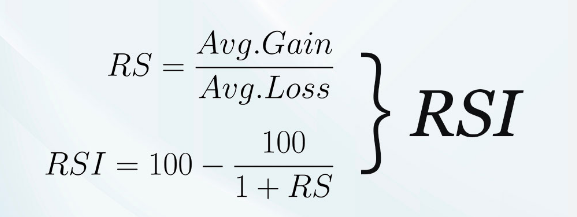
Where RS (Relative Strength) is the average gain of up days divided by the average loss of down days. This calculation helps determine whether a security is overbought or oversold, providing valuable insights into potential price movements. By understanding how to calculate and interpret the RSI, traders can better utilize the RSI divergence indicator to identify trading opportunities.
Types of RSI Divergence
There are two main types of RSI divergence:
1️⃣ Bullish RSI Divergence (Buy Signal)
📌 Definition: Occurs when price makes a lower low, but RSI makes a higher low.
📌 Indicates: The downtrend is losing momentum, signaling a potential upward reversal. Bullish RSI divergences are significant indicators for potential market reversals, signaling a shift from a downtrend to an uptrend.
Example of Bullish RSI Divergence
| Price Movement | RSI Movement | Trading Signal |
|---|---|---|
| Lower Low | Higher Low | Bullish Signal (Buy) |
How to Trade Bullish RSI Divergence
✔ Look for a trend reversal pattern (e.g., double bottom).
✔ Wait for confirmation with a breakout above resistance.
✔ Set a stop-loss below recent lows for risk management.
2️⃣ Bearish RSI Divergence (Sell Signal)
📌 Definition: Occurs when price makes a higher high, but RSI makes a lower high.
📌 Indicates: The uptrend is losing strength, signaling a potential downward reversal.
Example of Bearish RSI Divergence
| Price Movement | RSI Movement | Trading Signal |
|---|---|---|
| Higher High | Lower High | Bearish Signal (Sell) |
How to Trade Bearish RSI Divergence
✔ Look for a trend reversal pattern (e.g., head and shoulders).
✔ Wait for confirmation with a break below support.
✔ Place a stop-loss above recent highs to protect your trade.
It is crucial to confirm RSI divergence using additional technical tools and indicators to enhance accuracy and avoid false signals.
How to Use the RSI Divergence Indicator
The RSI divergence indicator helps traders automatically spot divergences without manually checking charts.
Steps to Use RSI Divergence Indicator
✅ Apply the RSI indicator (14-period) to your chart. ✅ Look for price action diverging from RSI readings. ✅ Confirm signals with support and resistance levels. ✅ Confirm the RSI divergence signal by identifying overbought or oversold RSI levels and waiting for candle closures to validate the divergence before executing a trade. ✅ Use additional indicators (MACD, Moving Averages) for validation.
🔍 Pro Tip: The RSI 6, 12, 24 setting adjusts RSI sensitivity:
- 6 RSI – Short-term trades
- 12 RSI – Medium-term trades
- 24 RSI – Long-term trends
Practical Tips for Trading RSI Divergence
Trading RSI divergence effectively requires a blend of technical analysis and sound risk management. Here are some practical tips to help you navigate RSI divergence signals:
Avoiding False Signals
One of the biggest challenges in trading RSI divergence is avoiding false signals. To mitigate this risk, consider the following strategies:
- Use Multiple Time Frames: Analyze RSI divergence across different time frames to confirm the signal’s validity.
- Confirm with Other Indicators: Validate RSI divergence signals with additional technical indicators such as MACD, Moving Averages, or trendlines.
- Trade with the Trend: Ensure you are trading in the direction of the prevailing trend to increase the likelihood of successful trades.
- Implement Risk Management: Use stop-loss orders and position sizing to manage risk and protect against potential losses.
By following these tips, you can enhance your ability to trade RSI divergence effectively and improve your overall trading strategy.
Common Mistakes to Avoid When Using RSI Divergence
🚨 Ignoring Confirmation – Always use trendlines, support/resistance, or moving averages to confirm the trade.
🚨 Trading Against Strong Trends – If a market is strongly trending, RSI divergence alone may not be reliable. Ignoring overbought or oversold conditions can lead to false signals, as these conditions are key metrics for assessing market momentum.
🚨 Not Using Stop-Loss – Protect against false signals with risk management strategies.
Conclusion: Is RSI Divergence a Good Trading Tool?
✔ Yes! RSI divergence is a powerful tool for detecting early trend reversals.
✔ When combined with other indicators and confirmation signals, RSI divergence can improve trade accuracy.
✔ Whether you’re a beginner or experienced trader, mastering RSI divergence can help you make smarter trading decisions.
In conclusion, mastering RSI divergence can significantly improve your trading decisions and accuracy.
💡 Ready to trade RSI divergence? Apply these strategies to your favorite trading platform and test them with a demo account before trading live! 🚀


Comments: 0